Exploratory Data Analysis of global COVID-19 data using SQL Server to uncover trends in infections,
deaths, and vaccinations.
Showcases advanced SQL techniques like joins,
aggregations, CTEs, window functions, and views.


This project focuses on cleaning and preparing the Nashville Housing dataset
using Microsoft SQL Server. The process includes handling NULL values,
removing duplicates, standardizing data formats, and optimizing data types to create
an analysis-ready dataset. The project demonstrates practical SQL skills in data cleaning,
data validation, and data quality improvement for real-world real estate data.

This project analyzes the relationship between key movie attributes
such as budget, votes, ratings, and runtime with box office revenue using Python.
Correlation analysis and visualizations were used to identify the factors that most
strongly influence a movie’s financial success.
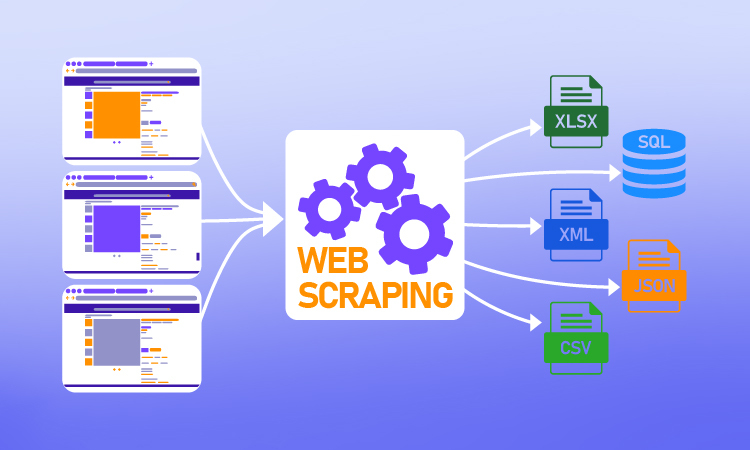
This project demonstrates an end-to-end Python data analysis workflow by scraping laptop product data
from Amazon using BeautifulSoup and Requests.
The collected data was cleaned using Pandas and analyzed with Matplotlib
and Seaborn to identify patterns in laptop ratings and customer reviews.

Analyzed a Data Professional Survey dataset using Power BI to visualize insights on salaries, job roles, programming languages, and job satisfaction.
Built an interactive dashboard to identify trends and key patterns among data professionals.

Analyzed a Data Professional Survey dataset using Power BI to visualize insights on salaries, job roles, programming languages, and job satisfaction.
Built an interactive dashboard to identify trends and key patterns among data professionals.

The Hotel Booking Trend Analysis Dashboard project focuses on analyzing hotel booking data from 2018 to 2020 to uncover key insights related to revenue growth, booking patterns, and customer market segments. The goal of this project was to transform raw hotel booking data into meaningful business insights using SQL for data preparation and Power BI for interactive visualization.

Developed a data analysis project that applies K-Means clustering to segment customers based on income and spending score. The project includes EDA, visualization, and cluster analysis to uncover patterns in customer behavior and support data-driven marketing decisions.

An end-to-end data analytics project using MS SQL and Power BI to analyze bike-sharing data, uncover user behavior trends, and generate actionable business insights through an interactive dashboard.
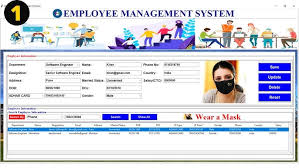
Built an end-to-end data analytics solution using SQL and Power BI to analyze employee performance, department insights, and project status. The dashboard provides interactive visualizations to track key business metrics and support data-driven decision-making.

Built an interactive Sales Analytics Dashboard using Power BI and SQL to analyze revenue, cost, and discount impact, enabling data-driven decisions and improved business profitability.

Developed an interactive sales dashboard to track key business KPIs including revenue, profit, and customer trends.
Leveraged SQL for data transformation and Power BI for dynamic visualizations.
Enabled data-driven decision-making through insights across product categories and regions.

Built an end-to-end retail analytics solution using SQL and Power BI to analyze sales trends, customer behavior, and weather impact through interactive dashboards and advanced data modeling.

Built a complete data analytics solution using SQL and Power BI to analyze global COVID-19 trends. The project includes advanced SQL transformations, dynamic KPIs, and an interactive dashboard for tracking cases, deaths, and vaccination progress.

Executed full data pipeline including data cleaning, validation, and advanced SQL analysis, and delivered business insights through an interactive Power BI dashboard highlighting sales trends and property valuation patterns.

A comprehensive analytics solution exploring decades of movie data to reveal revenue drivers, ROI trends, and untapped genre opportunities through interactive Power BI visualizations.

Built an end-to-end machine learning model to classify news articles as real or fake using NLP techniques like TF-IDF and classification algorithms such as Naive Bayes and Logistic Regression. Demonstrates strong skills in text preprocessing, feature engineering, and model evaluation.

Built an end-to-end data pipeline and interactive dashboard to analyze job market trends by extracting and visualizing in-demand data analytics skills such as SQL, Python, and Excel.
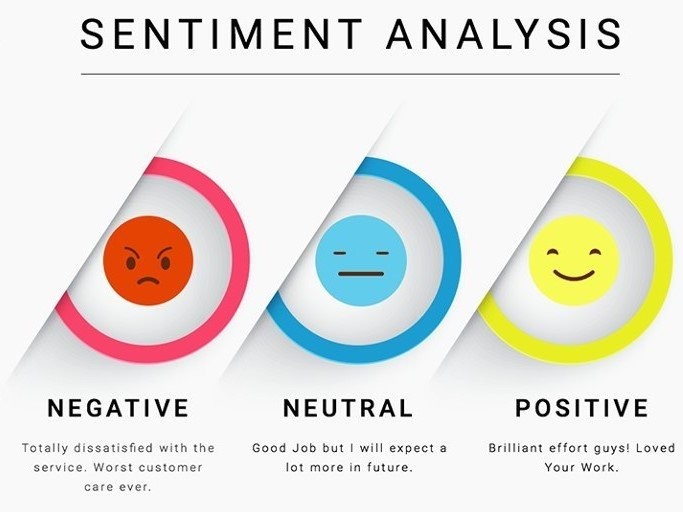
A Python-based NLP project that collects real-world text data through
web scraping, preprocesses it, and classifies sentiment as Positive,
Negative, or Neutral. Also analyzes the correlation between public
sentiment and stock price movements with visual reports.
An end-to-end AI pipeline that fetches real-time Tesla news, classifies sentiment using NLP, and correlates it with live stock prices — surfaced through an interactive dashboard.
Built a complete data + AI pipeline using NewsAPI, NLTK VADER, and yFinance to analyze how news sentiment influences TSLA stock movements. Processed 78 real articles across 14 media sources over 29 trading days, with automated preprocessing, daily sentiment aggregation, and regression-based correlation analysis — all visualized in a Streamlit dashboard.
Built an NLP system using BERT to classify news articles as fake or real, with a Streamlit-based web interface for real-time predictions.
Transforms unstructured news text into actionable insights using deep learning and transformer-based NLP.

Developed an end-to-end LLM-powered PDF chat application that allows users to interact with documents through natural language queries.
The system uses Retrieval-Augmented Generation (RAG) to extract relevant content from PDFs and generate accurate, context-aware responses. Implemented semantic search using FAISS vector database and transformer-based embeddings to improve retrieval quality.
Integrated a local LLM (Ollama) to eliminate dependency on external APIs, enabling offline usage. Built an interactive UI using Streamlit that supports features like resume summarization, skill extraction, and contextual question answering.
This project demonstrates practical application of LLMs, vector databases, and real-world AI system design.
Designed a resume analysis tool that uses LLMs and embeddings to match candidate profiles with job requirements. Highlights matched skills, identifies gaps, and delivers structured insights to support better job-fit evaluation.

Built an AI-powered career assistant using Django, Streamlit, LangChain, and FAISS that analyzes resumes against job descriptions, calculates ATS-style match scores, detects skill gaps, generates personalized learning roadmaps, creates technical interview questions, and provides AI-based resume improvement suggestions using RAG pipelines and semantic search.